The 2026 real estate market started with more motivated buyers, eager to find their homes with low inventory through February. This pent-up demand resulted in multiple offers and higher sale’s prices, as buyers competed to obtain their homes, especially with single family homes.
In March, we saw a high increase of listings & a turbulent economy, with challenging tariffs and a war in Iran, resulting in an oil shortage crisis. As is virtually always the case, well-priced and prepared, and effectively marketed new listings can still sell quickly, often well above the asking price.
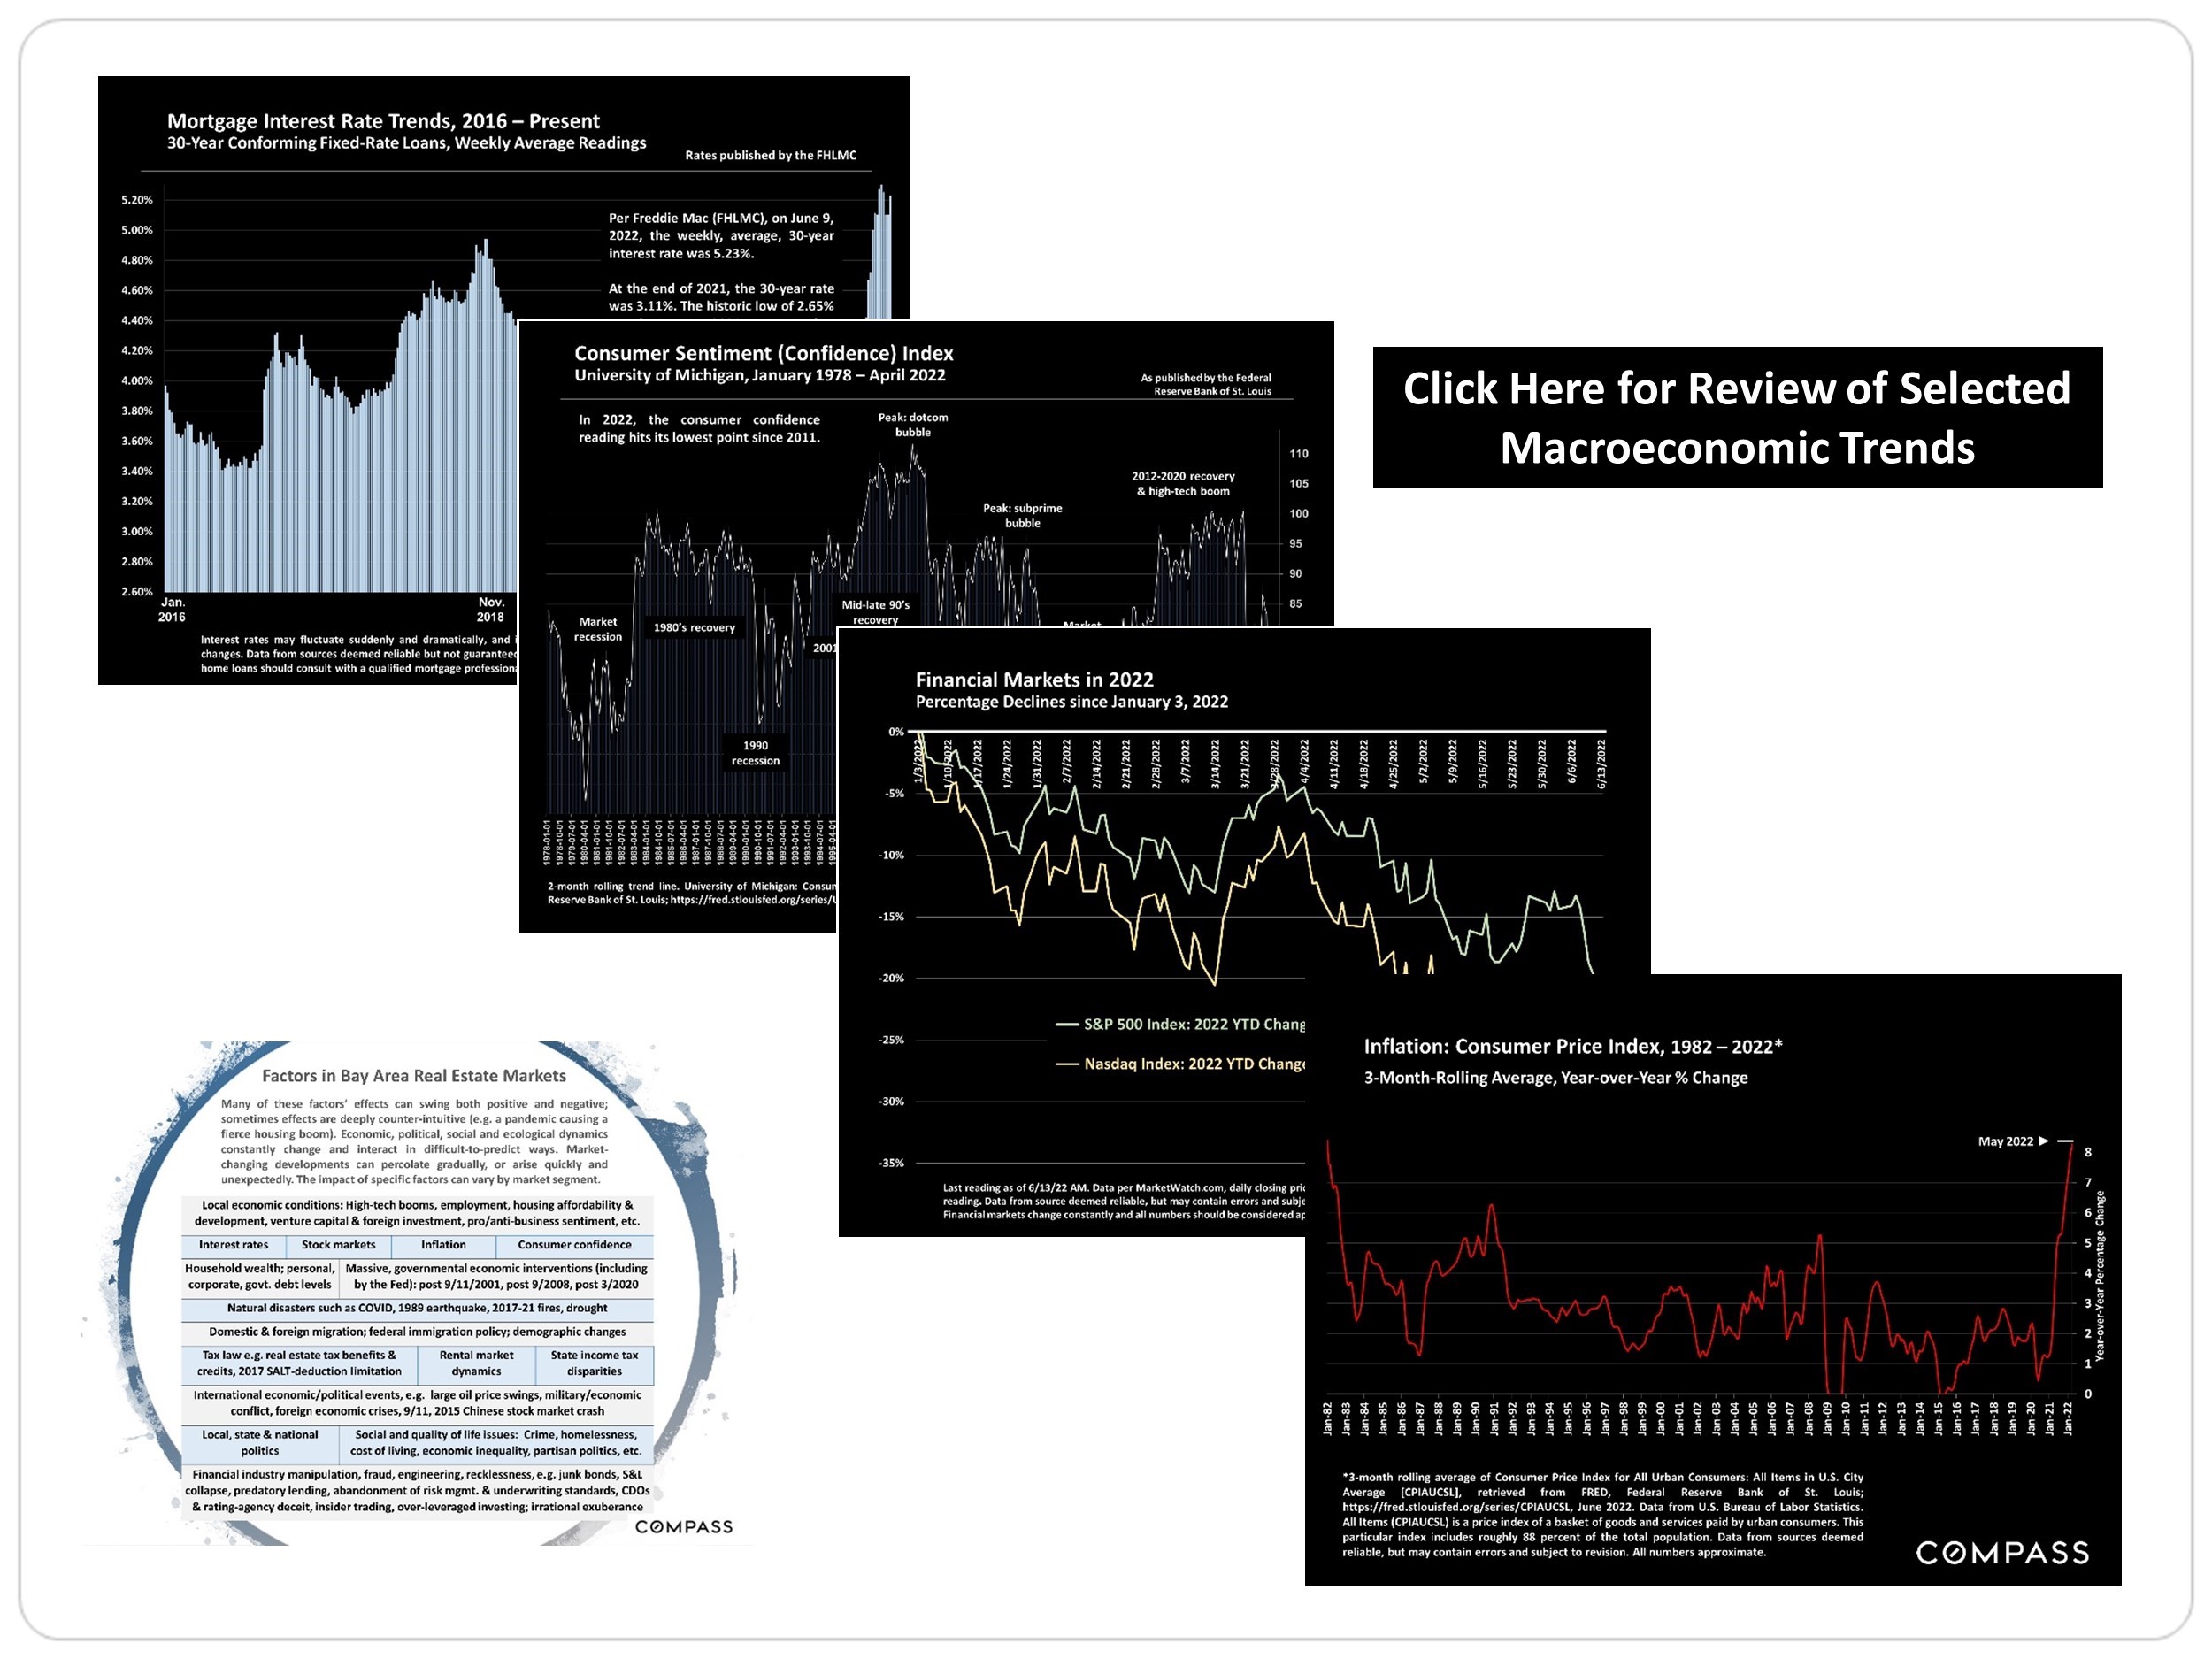
In the broader financial landscape, consumer confidence showed a decrease from earlier in the quarter and remains very low by long-term standards. Attention is now focused on the Federal Reserve’s upcoming decision regarding the current rates with threats of a recession looming given the war and a jittery market. See Patrick Carlisle, Compass
2026 Housing Market Projections
Key Factors Influencing 2026
THE 2026 RED PAPER
WEALTH AND MARKET REPORT
Based on the tariffs, we had a really slow spring market, where it basically stopped for 3 months from March through May due to the volatile stocks and uncertain economy. Note that the spring market is usually our strongest of the year! This resulted in that summer became a late spring market and more momentum for the fall market as well.
With mortgage rates trending downward, we should see increased buyer activity and more competition for listings. As you know, the fall market is really September through October, as the market slows down for the holiday season and then picks up early in the new year! Let me know if I can help you in any way, as it is a great time to sell too!
|
It is impossible to know how median and average value statistics apply to any particular home without a specific comparative market analysis. These analyses were made in good faith with data from sources deemed reliable, but may contain errors and are subject to revision. It is not our intent to convince you of a particular position, but to attempt to provide straightforward data and analysis, so you can make your own informed decisions. Median and average statistics are enormous generalities: There are hundreds of different markets in San Francisco and the Bay Area, each with its own unique dynamics. Median prices and average dollar per square foot values can be and often are affected by other factors besides changes in fair market value. Longer term trends are much more meaningful than short-term.
Median list price for Santa Clara County, CA is $1,899,975. Inventory has held steady at or around 884.
When rates start to decline, there will be an influx of buyers and sellers. Per lenders and top analysts, we are expected to get into the mid 5.5% range by the 1st quarter 2026!
Housing demand will be fueled by the largest generation of potential homebuyers – the millennials!
The average homeowner equity is about $274K
*Data provided by Buffini & Inman
SAN MATEO COUNTY
SOLD HOMES ↓22% YOY
AVERAGE DAYS ON MARKET ↑32% YOY
MEDIAN SALES PRICE ↑1% YOY
PRICE PER SQUARE FOOT ↓2% YOY
SAN MATEO COUNTY
SOLD HOMES ↓14% YOY
AVERAGE DAYS ON MARKET ↑1% YOY
MEDIAN SALES PRICE ↑1% YOY
PRICE PER SQUARE FOOT ↓3% YOY
SANTA CLARA COUNTY
SOLD HOMES ↓23% YOY
AVERAGE DAYS ON MARKET ↑11% YOY
MEDIAN SALES PRICE ↓2% YOY
PRICE PER SQUARE FOOT ↑2% YOY
SANTA CLARA COUNTY
SOLD HOMES ↓8% YOY
AVERAGE DAYS ON MARKET ↓24% YOY
MEDIAN SALES PRICE ↑3% YOY
PRICE PER SQUARE FOOT ↑6% YOY
She is personally committed to her clients’ success and her impressive results are in selling her listings within 10 days with multiple offers! Contact Lynn for a free consultation on your home.